YOY Anadromous Fish Retrospective Analysis
SYNOPSIS
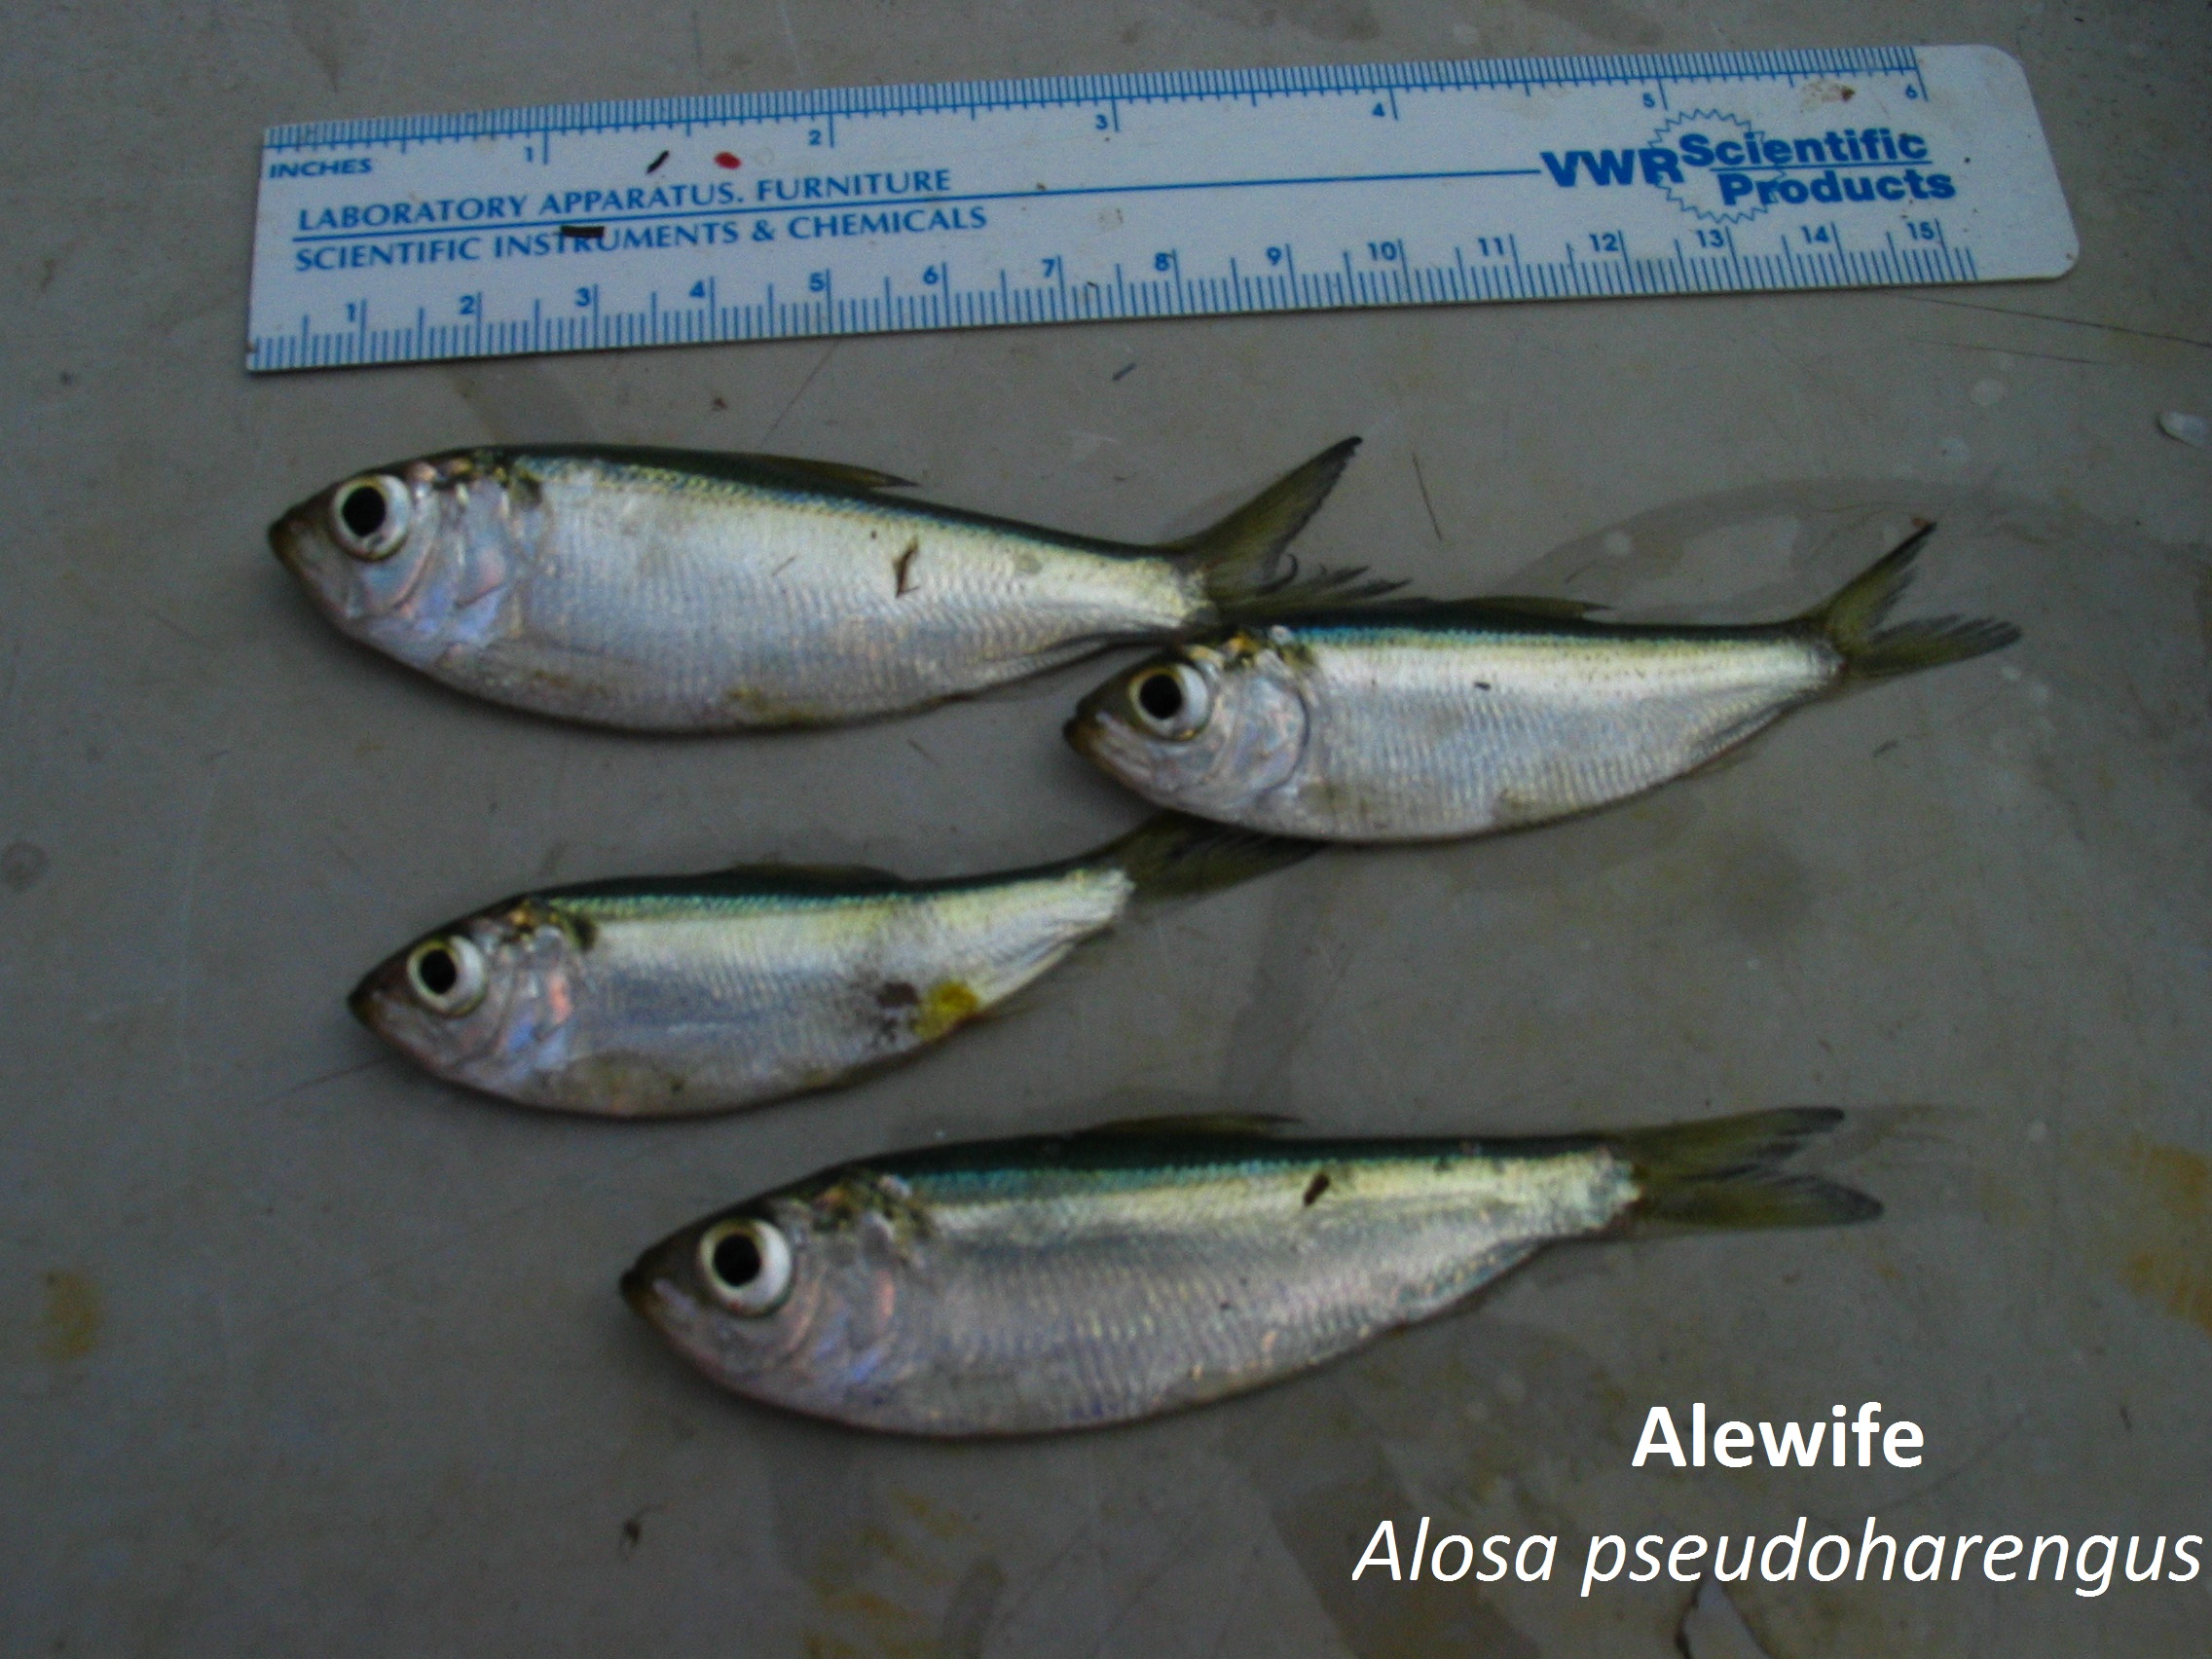
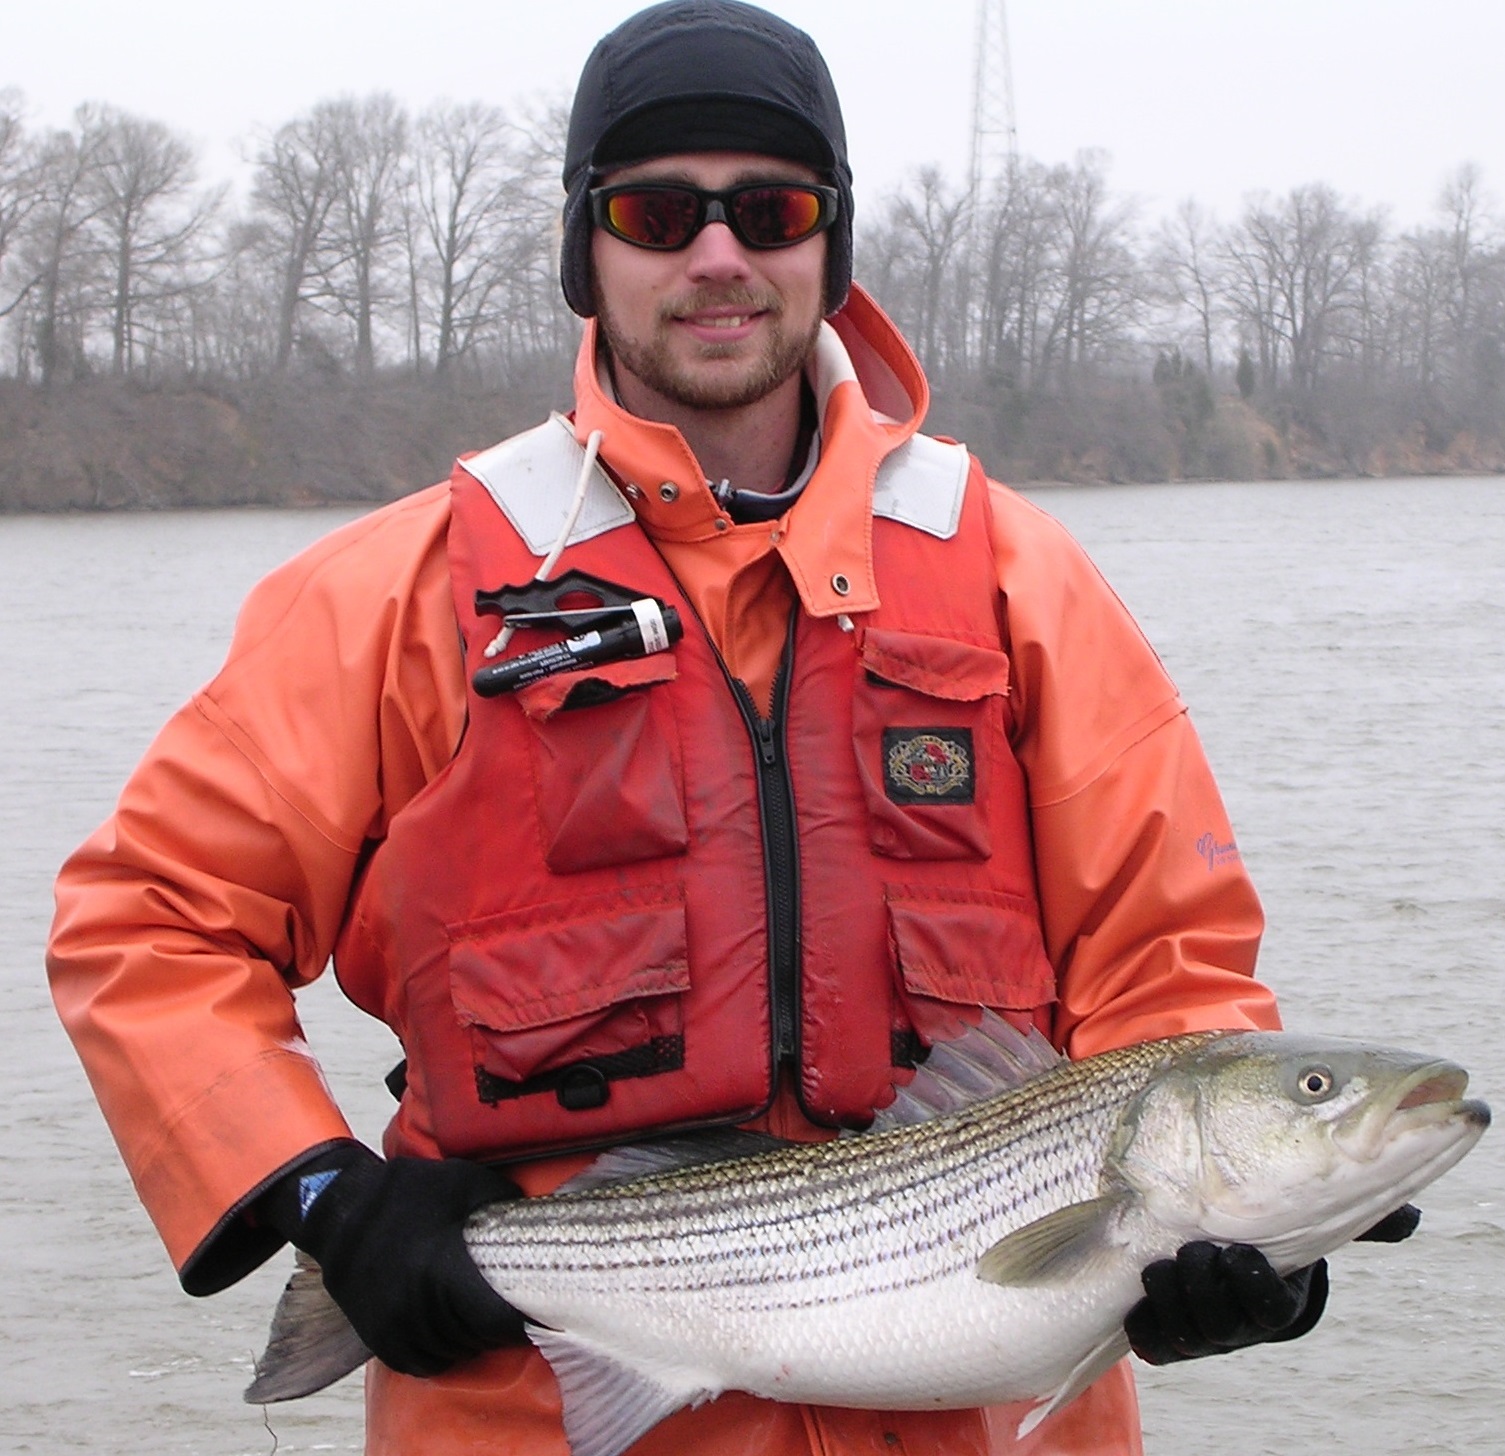
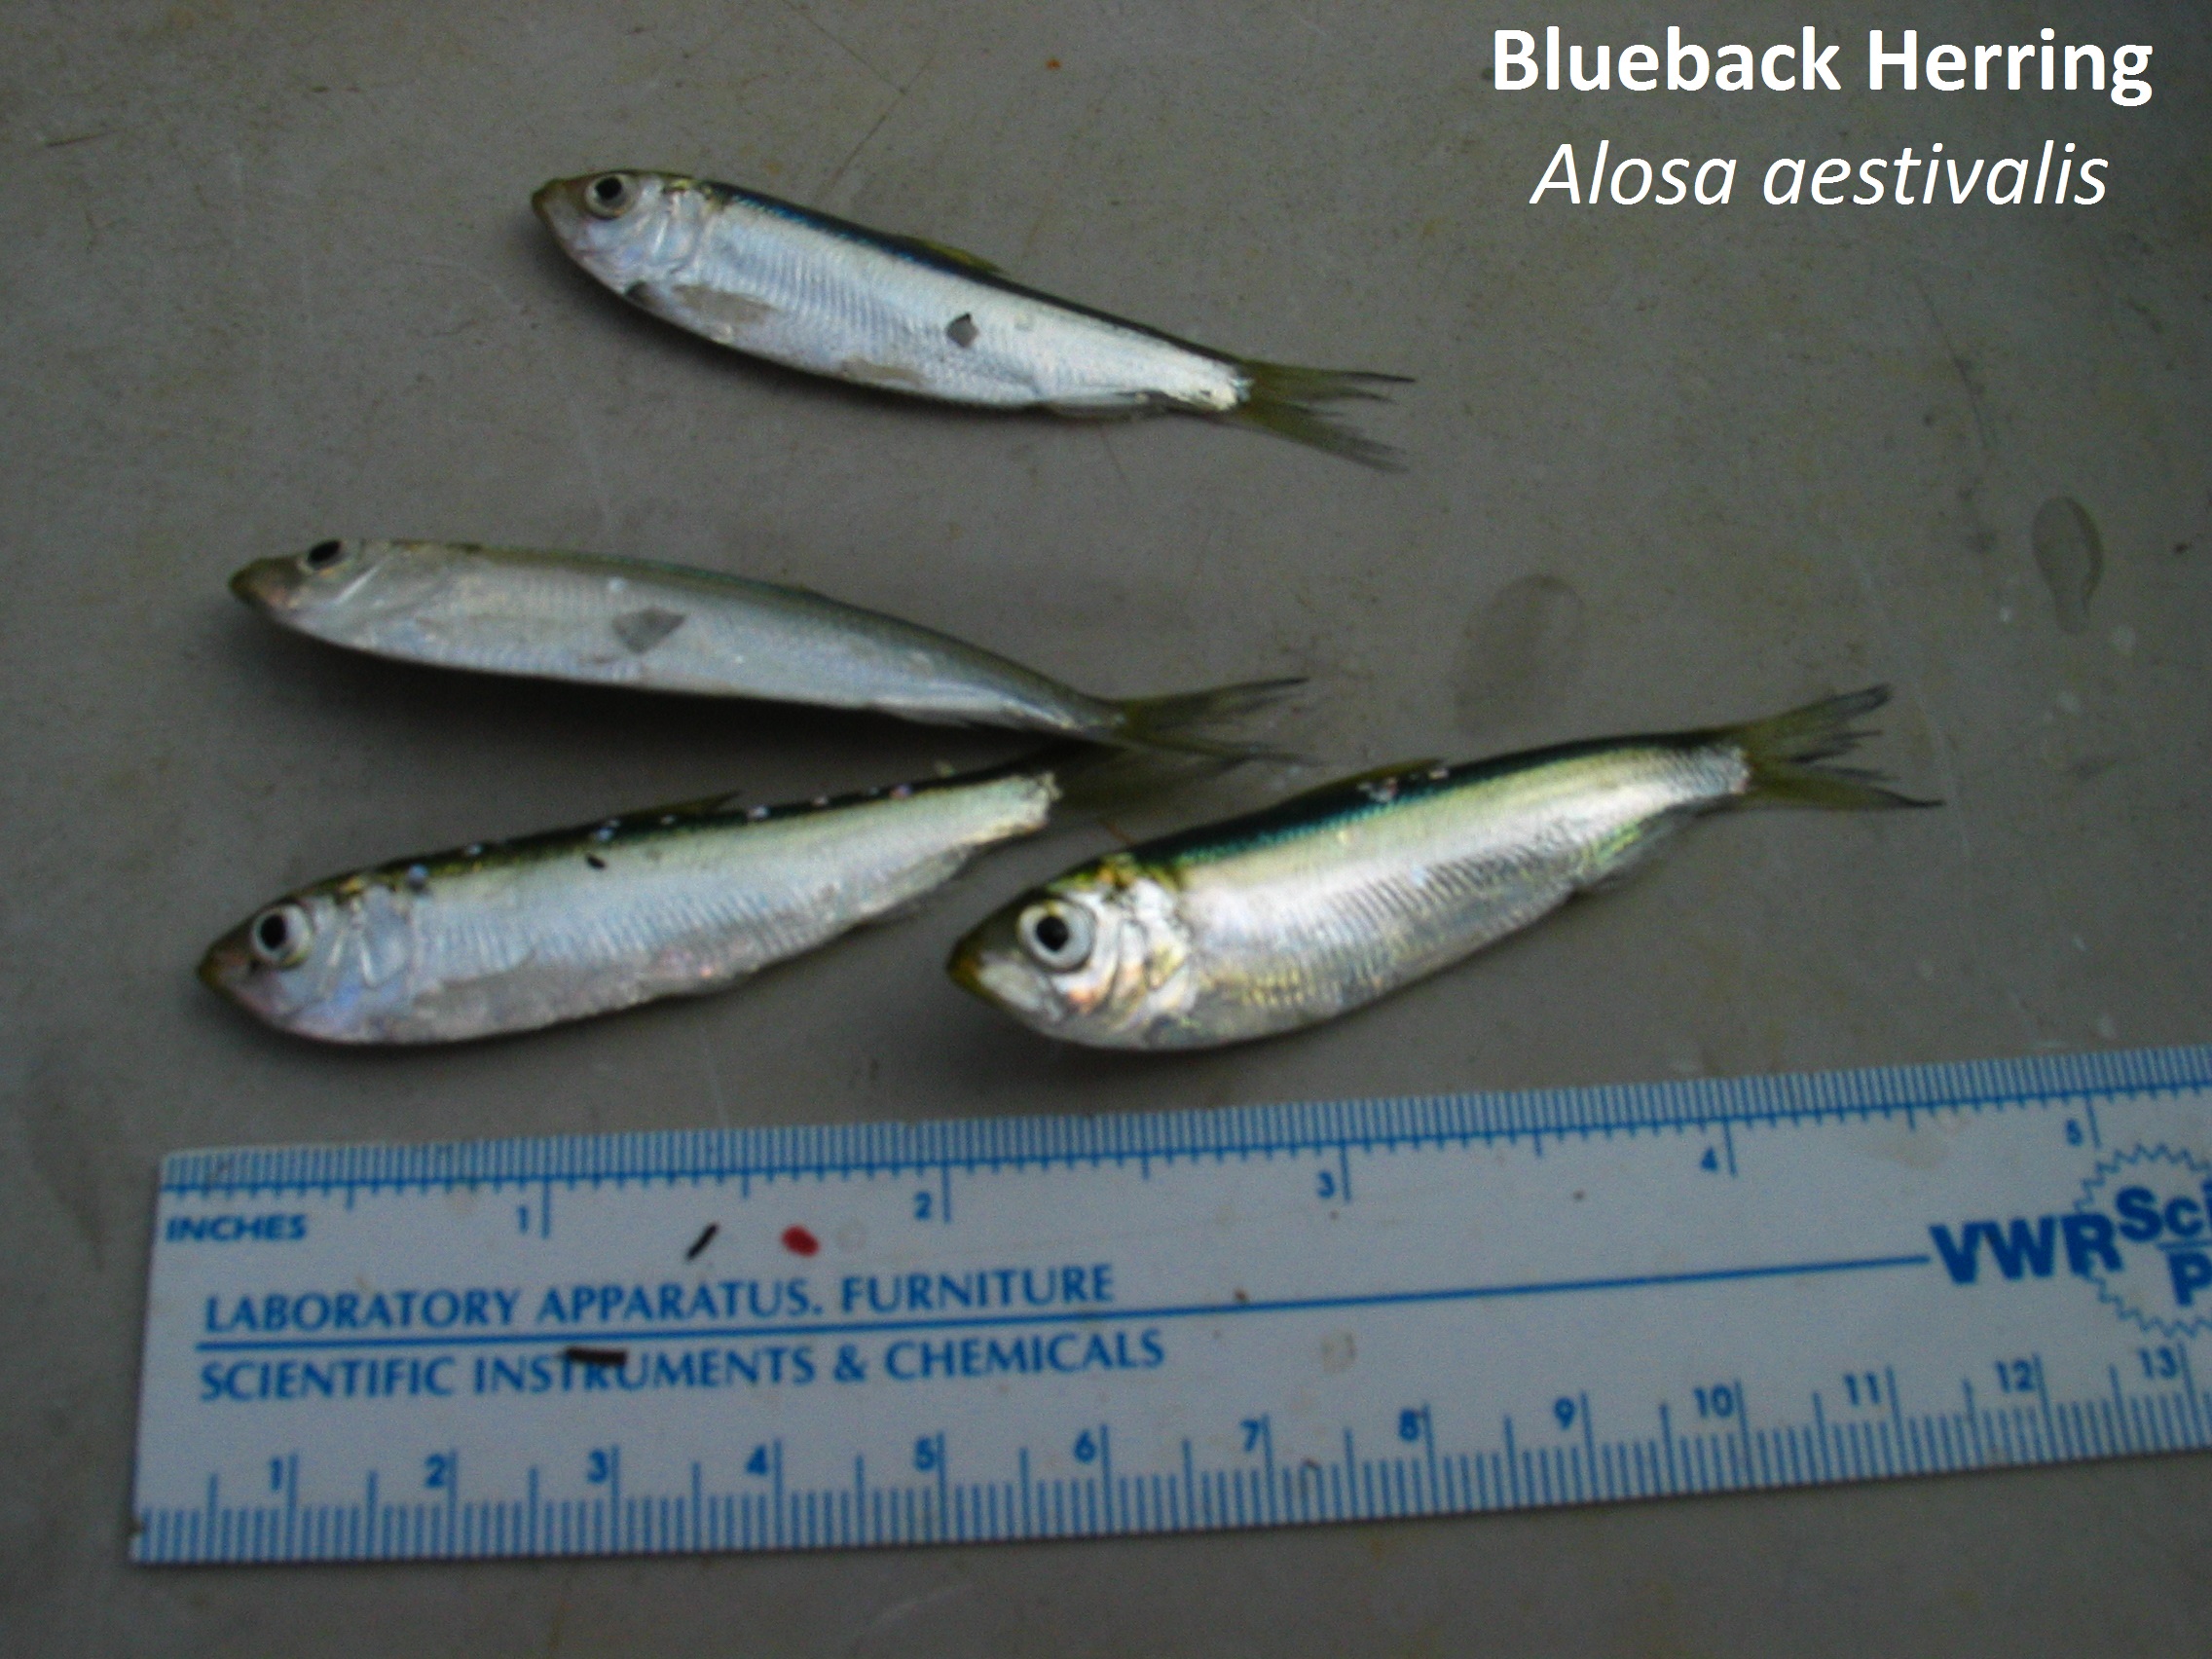
Production of young anadromous fishes, termed recruitment success, including striped bass, white perch and shads/river herrings, in Maryland tributaries of Chesapeake Bay varies dramatically from year to year. The tributaries and watersheds supporting production of young anadromous fishes differ in the degree of human development and impacts that may affect reproductive success. A retrospective analysis of fish and environmental factors, based on monitoring surveys from 1959 to 2011, is being conducted to determine if decadal changes have occurred. Abundance, sizes, growth rates, and production of young-of-the-year anadromous fishes are being estimated based on data in the Maryland Department of Natural Resources Juvenile Striped Bass Seine Survey. Additionally, data on taxable, man-made structures, a proxy for level of human development and anthropogenic stress, are being evaluated in the Choptank, Nanticoke and Patuxent rivers watersheds to determine effects on productivity of young-of-the-year anadromous fishes.
Perhaps surprisingly, significant increases in the overall abundance and biomass of young-of-the-year anadromous fishes were detected in the tributaries. However, negative temporal trends were detected in mean sizes of some anadromous fish taxa, suggesting a decline in growth rate in recent decades. Few of the observed weak trends were judged to be statistically significant. Some shifts in spatial distribution of anadromous fishes occurred during the 53-yr time series, with shifts being primarily downriver. Multivariate statistical analysis is being conducted to identify correlations and temporal patterns among water quality parameters, freshwater flow, anadromous fish abundances and their centers of abundance.
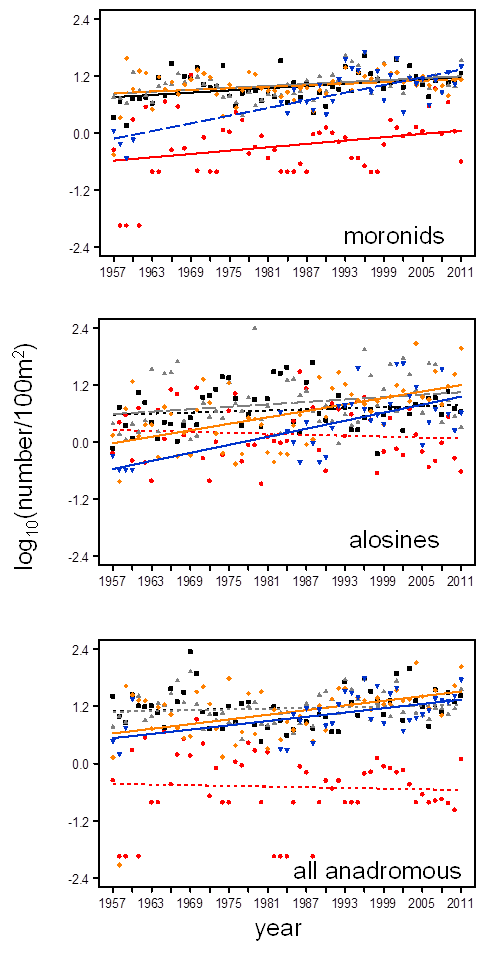
Trends in log10 - transformed density (i.e., abundance) of moronids (striped bass and white perch), alosines (river herrings and shads), and all anadromous species combined. Data from the upper Bay, black; Choptank, red; Nanticoke, gray; Patuxent, blue, and Potomac, orange. Solid lines represent statistically significant regressions (p-values ≤ 0.05). Dashed lines indicate regressions near significance (0.05 < p ≤ 0.10). Dotted lines indicate regressions with p > 0.10.
Taxable Structures
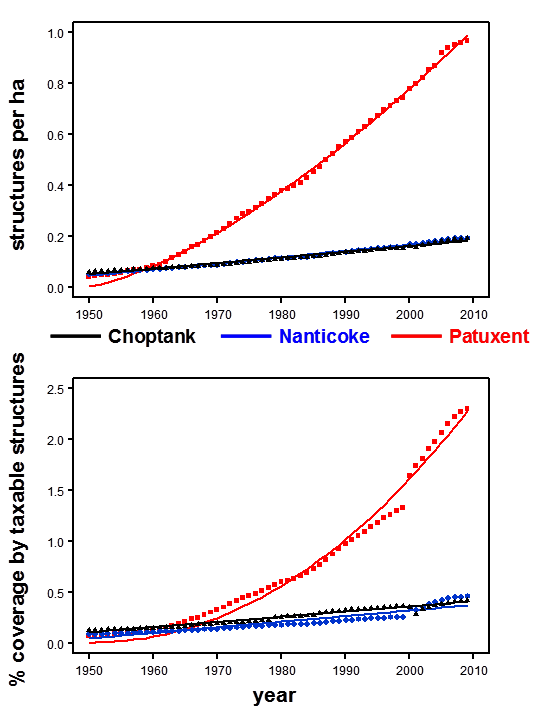
Increase in all three
watersheds. Rapid
increase in the Patuxent
watershed
The number of structures
increased by 0.002 per
hectare per yr (0.5% annual
rate) in the Nanticoke
and Choptank but by 0.12
per hectare per yr (1.7%
annual rate) in the Patuxent
watershed since 1950.